I’d also like to use my blog to write about a few of my personal projects. Many of these aren’t very useful and very few actually reach any usable state, however I feel node_debug is actually something quite useful.
Before reading this post you should probably know what node.js is.
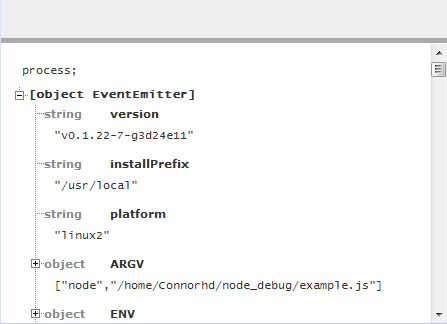
node_debug allows you to evaluate statements and view their result (much like a REPL) from your favourite browser (assuming your favourite browser isn’t IE). It also allows you to browse objects if the result of your statement is an object, for example the global object in node is process so executing process; will return a browsable tree structure of the global scope.
Additionally it exports a log function that allows you to asynchronously output to any active console, for example setTimeout(function () { debug.log("Hello") }, 5000); will output Hello to any open consoles after 5 seconds, allowing useful debug output when using asynchronous functions.
To get started using node_debug you need to have a server running node, and to grab the latest node_debug from github. There is an example.js included to show how you would include it in your own scripts, the idea being you can simply include this in your own project in order to easily debug issues.
Future features I would like to add include:
- A debug.scope object that allows you to import other objects into the debuggers scope (currently only the global scope is available which can cause confusion due to closures in JavaScript hiding a lot of variables from the debugger).
- debug.error/warn/info functions in line with the browser console object provided by firebug.
- Detect disconnection from node and attempt reconnection.
- Caching of asynchronous messages that can be shown when connecting to the console, in order to log things without having an active browser window all the time.


